MarS: A Financial Market Simulation Engine
Powered by Generative Foundation Model
We propose Large Market Model (LMM), an order-level generative foundation model, for financial market simulation, akin to language modeling in the digital world. Our financial Market Simulation engine (MarS), powered by LMM, addresses the domain-specific need for realistic, interactive and controllable order generation. Key observations include LMM's strong scalability across data size and model complexity, and MarS's robust and practicable realism in controlled generation with market impact. We showcase MarS as a forecast tool, detection system, analysis platform, and agent training environment, thus demonstrating MarS's ``paradigm shift'' potential for a variety of financial applications.
MarS Applications

Forecast

Forecasting is crucial in many financial applications, with market trend forecasting being a prime example. This task demands models that accurately capture and reflect market dynamics. Traditionally, direct forecasting models are used. We compare our model with DeepLOB. The figure above shows the trend prediction accuracy, illustrating that LMM-based simulations significantly outperform DeepLOB, highlighting its superior market dynamics understanding. Additionally, the 1.02 billion-parameter model outperforms the 0.22 billion-parameter model, indicating that improved validation loss in scaling curve correlates with enhanced forecasting performance. It is noteworthy that all forecasting targets can be calculated using simulated trajectories from MarS, whereas traditional direct forecasting models require separate training for each target. This underscores the significant advantage of simulation-based forecasting by MarS.
Detection

In addition to forecasting future trends, comprehending the current and recent market conditions constitutes a significant category of financial tasks. Regulation particularly market abuse regulation holds a crucial position in this type of tasks. Based on MarS's realism in a normal market, a straightforward principle for anomaly detection is that a quick drop in simulation realism metrics indicates potential anomalies. We collected replay samples before (left), during (middle) and after (right) the manipulation, and conducted simulations by MarS simultaneously. The results are shown on figure above. While MarS generally performs well to simulate the normal market, its performance drops during the manipulation, showing a heavier tail and a peak around spread=1000. These anomalies likely correspond to market manipulation, where manipulators significantly impact liquidity, widening the spread. These anomalies, less frequent in normal markets, lead to a performance drop in MarS, suggesting a new detection approach by monitoring such similarity drops. Consequently, MarS helps investors avoid anomalies and assists institutions in maintaining market stability.
"What IF" Analysis on Market Impact
One of the most important ''What if'' topics in finance is to analyze market impact, the change in asset prices caused by trading activity. We attempt to leverage the synthetic data to build data-driven pipeline to discover new laws to explain market impact and its long-term dynamics.
Analysis of Generated Market Impact

We explore the potential market impact using a "What IF" analysis by simulating the effects of different trading strategies under various configurations. Specifically, we use the TWAP strategy with four distinct configurations: L1-P0.1, L1-P0.9, L5-P0.1, and L5-P0.9. The configuration name LX-PY indicates that the aggressive price (AP) is askX and the maximum passive volume ratio (PVR) is Y. Our "What IF" analysis yields the following insights:
- As shown in figure left-above, despite the different configurations, the synthetic market impact follows a pattern similar to the Square-Root-Law model, showing consistency with known market impact behavior.
- Agents with more aggressive configurations (L5-P0.1 and L5-P0.9) are expected to exhibit a larger market impact and achieve a higher fulfillment rate. Our simulations quantify their differences and confirm these assumptions, as illustrated in the figure middle-above.
- The agents generate both short-term and long-term market impacts in MarS, as shown in the figure right above, similar to observations studied in previous empirical work. We also observe that agents with a larger passive volume ratio generate less momentum after trading ends.
New factors beyond Square-Root-Law

Market impact is notoriously difficult to predict due to noise and randomness in observed data. Using MarS's synthetic data, we perform a "What IF" analysis to explore new, interpretable laws beyond the traditional Square-Root-Law. By constructing a data-driven pipeline and applying genetic algorithms with symbolic regression, we identify three significant factors {resiliency, LOB_pressure, LOB_depth} that strongly influence market impact during trading. These factors provide a deeper understanding of how market conditions can shape price movements and execution behavior over time, offering a more nuanced view of trading dynamics.
Dynamics of Long-Term Market Impact
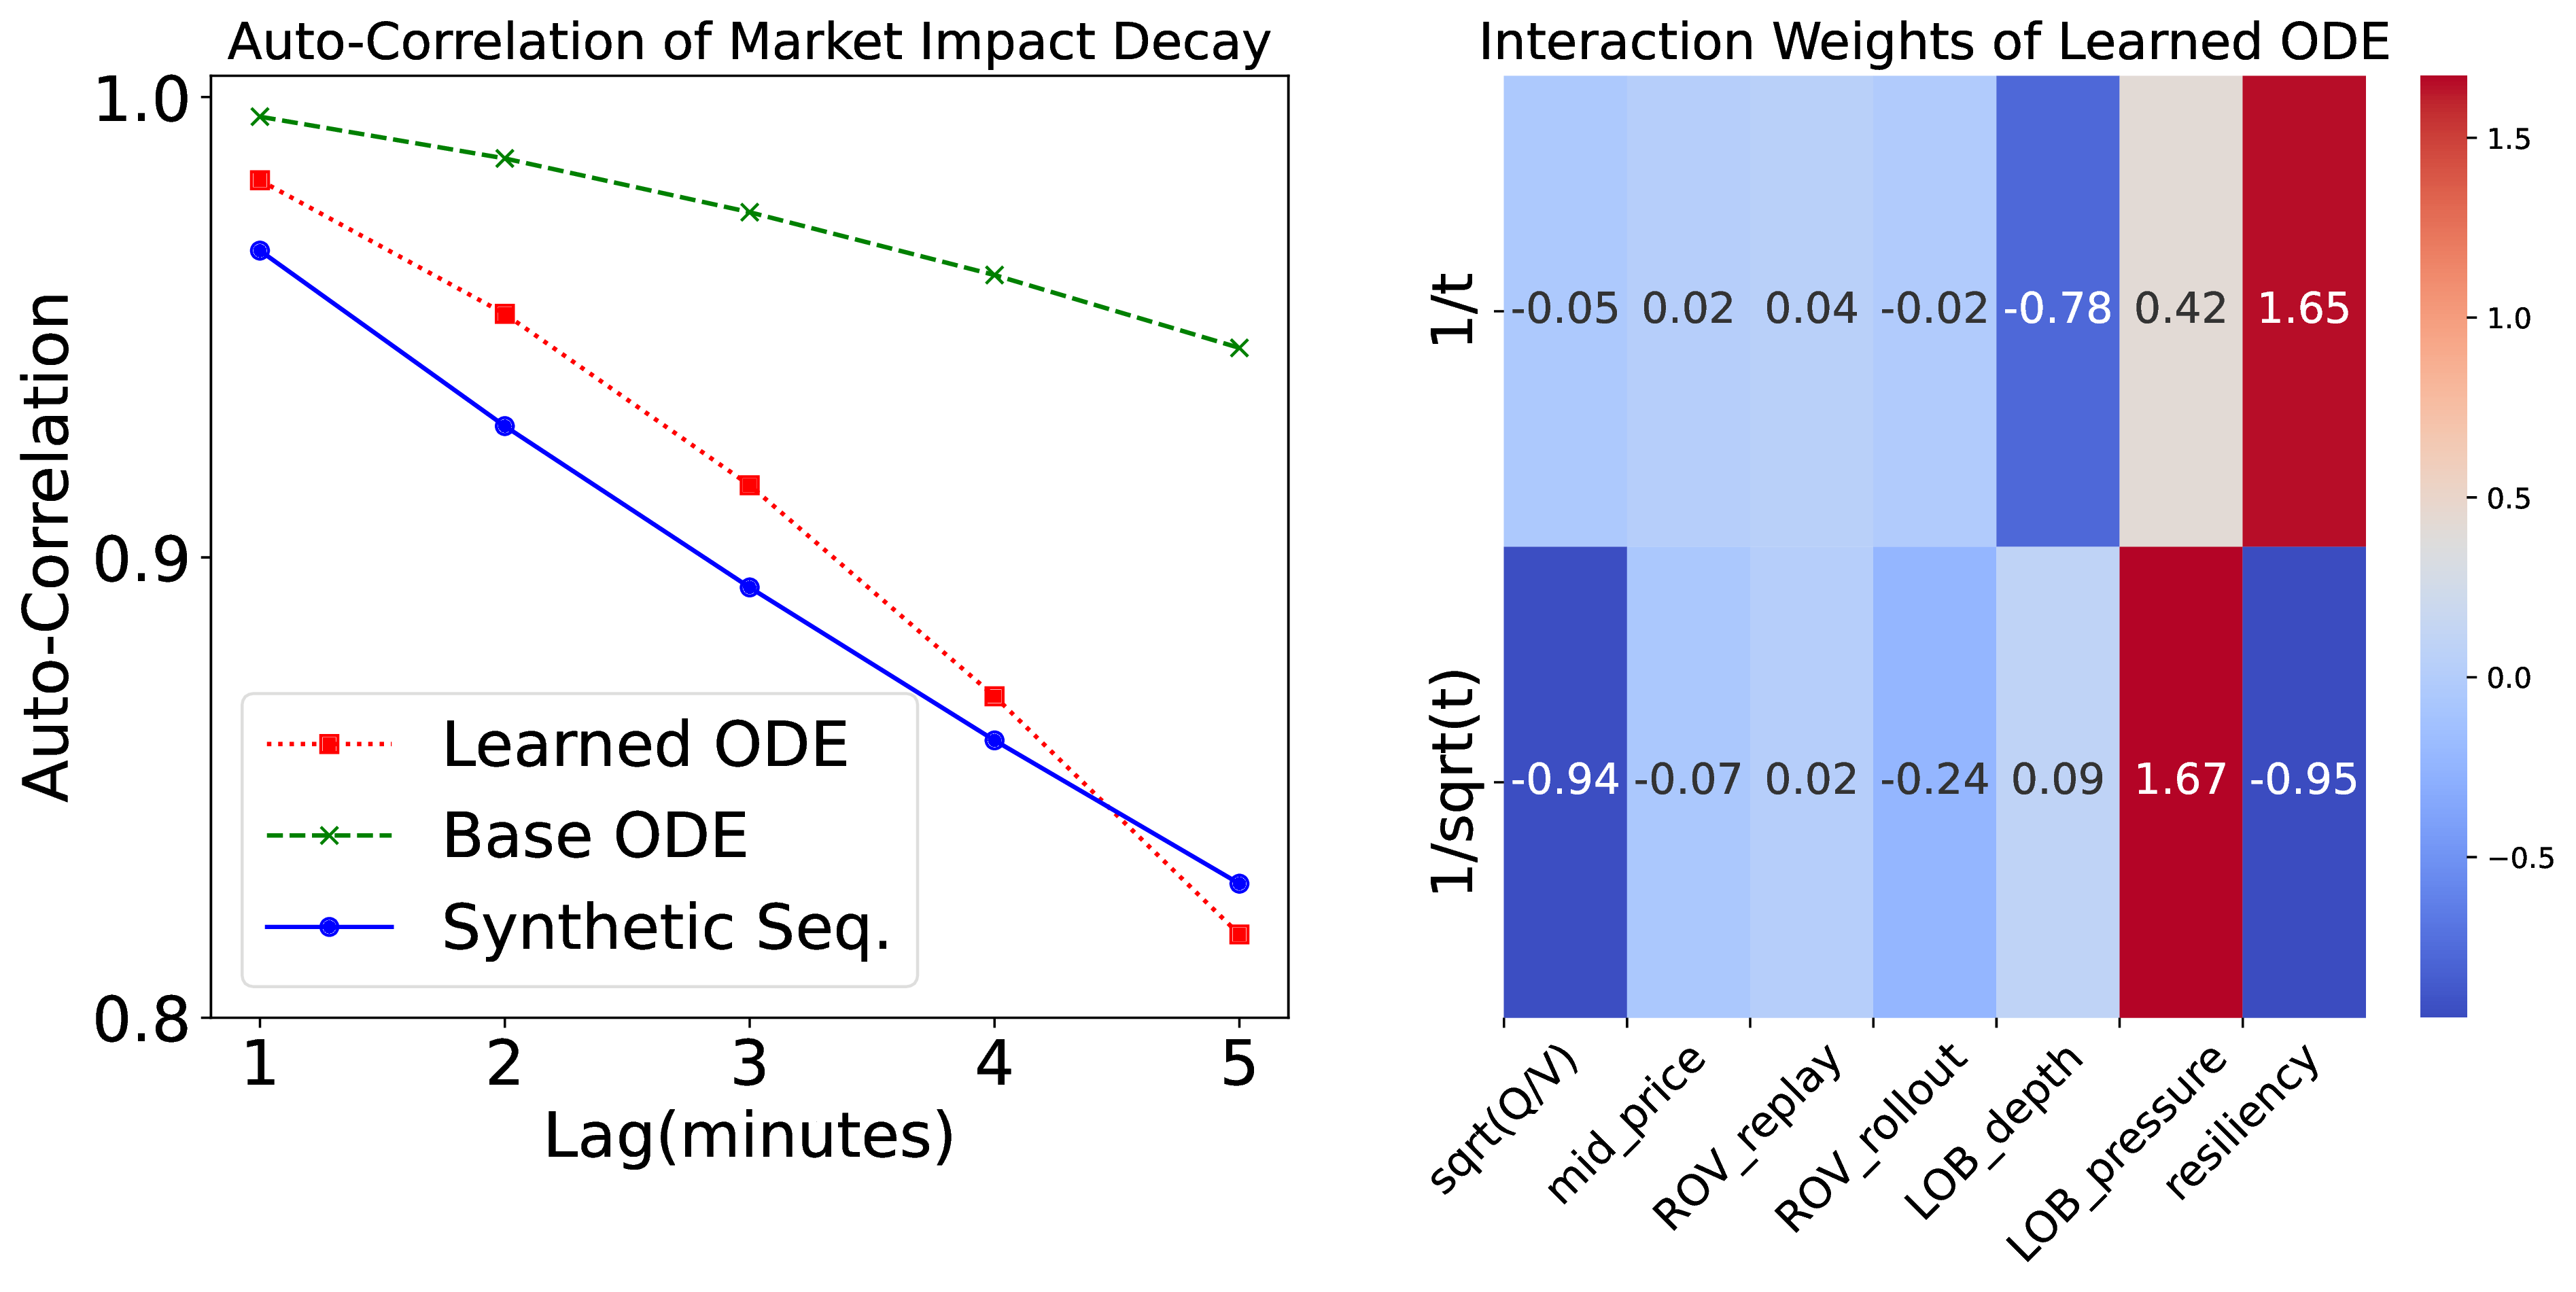
The long-term market impact, also known as price impact trajectory, typically manifests as a gradually decaying sequence of price fluctuation after a trade. We develop an Ordinary Differential Equation (ODE) model (as shown in Equation ) below to capture the decay of market impact after trades are executed. Our method models the decay of market impact using an ordinary differential equation(ODE), which integrates both potential influencing factors and decay functions:
where $Y(t)$ is the long-term market impact, $X \in \mathbb{R}^m$ is the factor group, such as volume, price, etc., and $F^{\text{decay}}(t): t \rightarrow \mathbb{R}^n $ includes possible decay functions, e.g., $ [1/t, \ldots, 1/\sqrt{t}]$. $X$ and $F^{\text{decay}}(t)$ can be customized based on domain knowledge. $\otimes$ is the outer product, $\circ$ is the Hadamard product, $X^{T} \otimes F^{\text{decay}}(t)$ is a matrix with size $\mathbb{R}^{n \times m}$, representing interactions among factors and decay patterns, and \(W \in \mathbb{R}^{n \times m}\) is the learnable interaction weight. Equation can explain how factors with different decay patterns contribute to the long-term market impact. The figure left-above illustrates the auto-correlation of the synthetic market impact decay, and trajectories predicted by the learned ODE, and the base ODE from empirical formulas. The figure right-above shows the learned weights $W$, demonstrating the importance of interaction pairs of two decay functions and seven factors, which can help to deepen our understanding of the long-term market impact.
Reinforcement Learning Environment
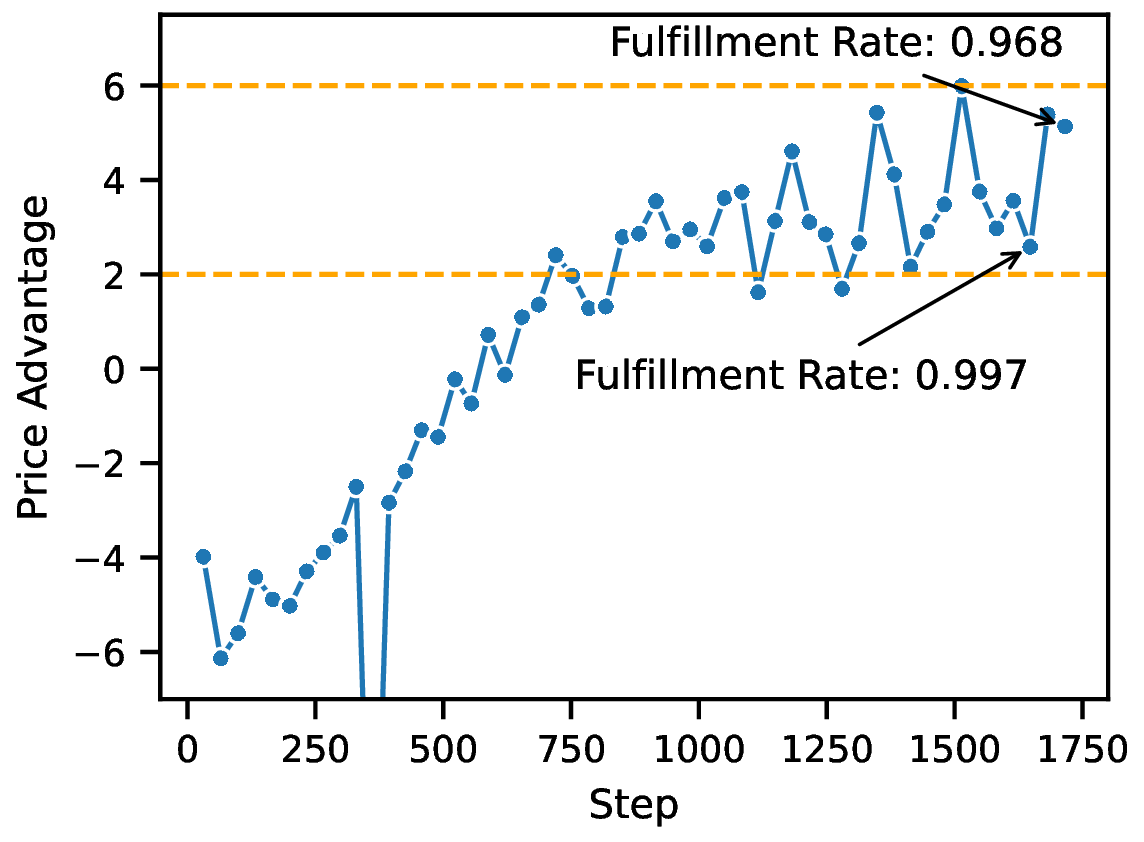
The MarS environment, being both realistic and interactive, is ideal for training reinforcement learning (RL) agents. This environment accurately reflects an agent's impact, provides realistic rewards, and facilitates training robust agents for the financial market. In this experiment, we aim to train a trading agent from scratch using MarS. The trading agent's goal is to purchase a large volume within 5 minutes, optimizing both fulfillment rate and price advantage. The above figure shows the test performance of the trading agent. The agent's performance improves from -6 BP to 2~6 BP during training. The observed fluctuations between 2~6 BP are attributed to the agent exploring various strategies between high and low fulfillment rates, resulting in corresponding variations in price advantage based on the current reward setting. This demonstration highlights that MarS is capable of training trading agents from scratch by leveraging its realistic and interactive simulation capabilities. A more comprehensive training design could yield even stronger performance.
High-level Overview
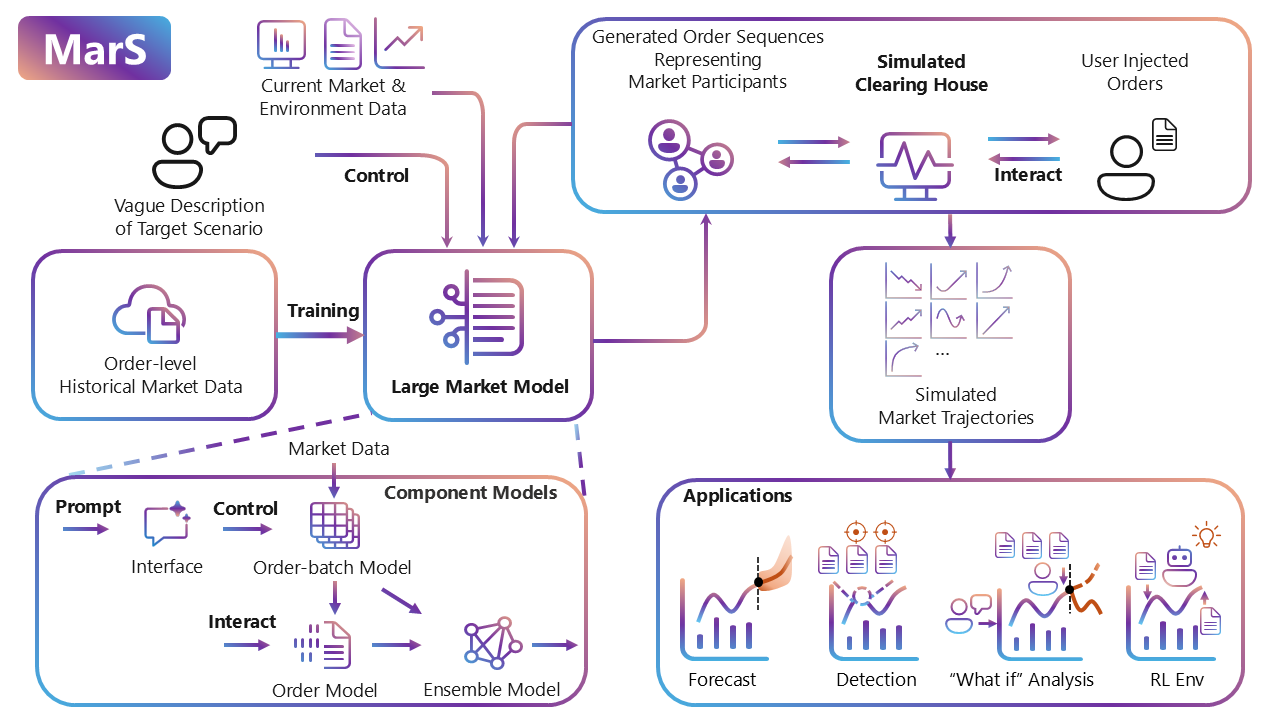
MarS is powered by a generative foundation model (LMM) trained on order-level historical financial market data. During real-time simulation, LMM dynamically generates order series in response to various conditions, including user-injected interactive orders, vague target scenario descriptions, and current/recent market data. These generated order series, combined with user interactive orders, are matched in a simulated clearing house in real-time, producing fine-grained simulated market trajectories. The flexibility of LMM's order generation enables MarS to support various downstream applications, such as forecasting, detection systems, analysis platforms, and agent training environments.
Experiments
We thoroughly evaluate MarS's capabilities across five key areas: scalability, realism, controllability, interactivity, and the balance between control and interaction. These experiments are designed to test MarS's performance in generating realistic market simulations, its adaptability to predefined conditions, and its ability to model dynamic market interactions. Each experiment highlights a critical aspect of MarS's design, demonstrating its potential for use in practical financial applications.
Scaling Law in Large Market Model
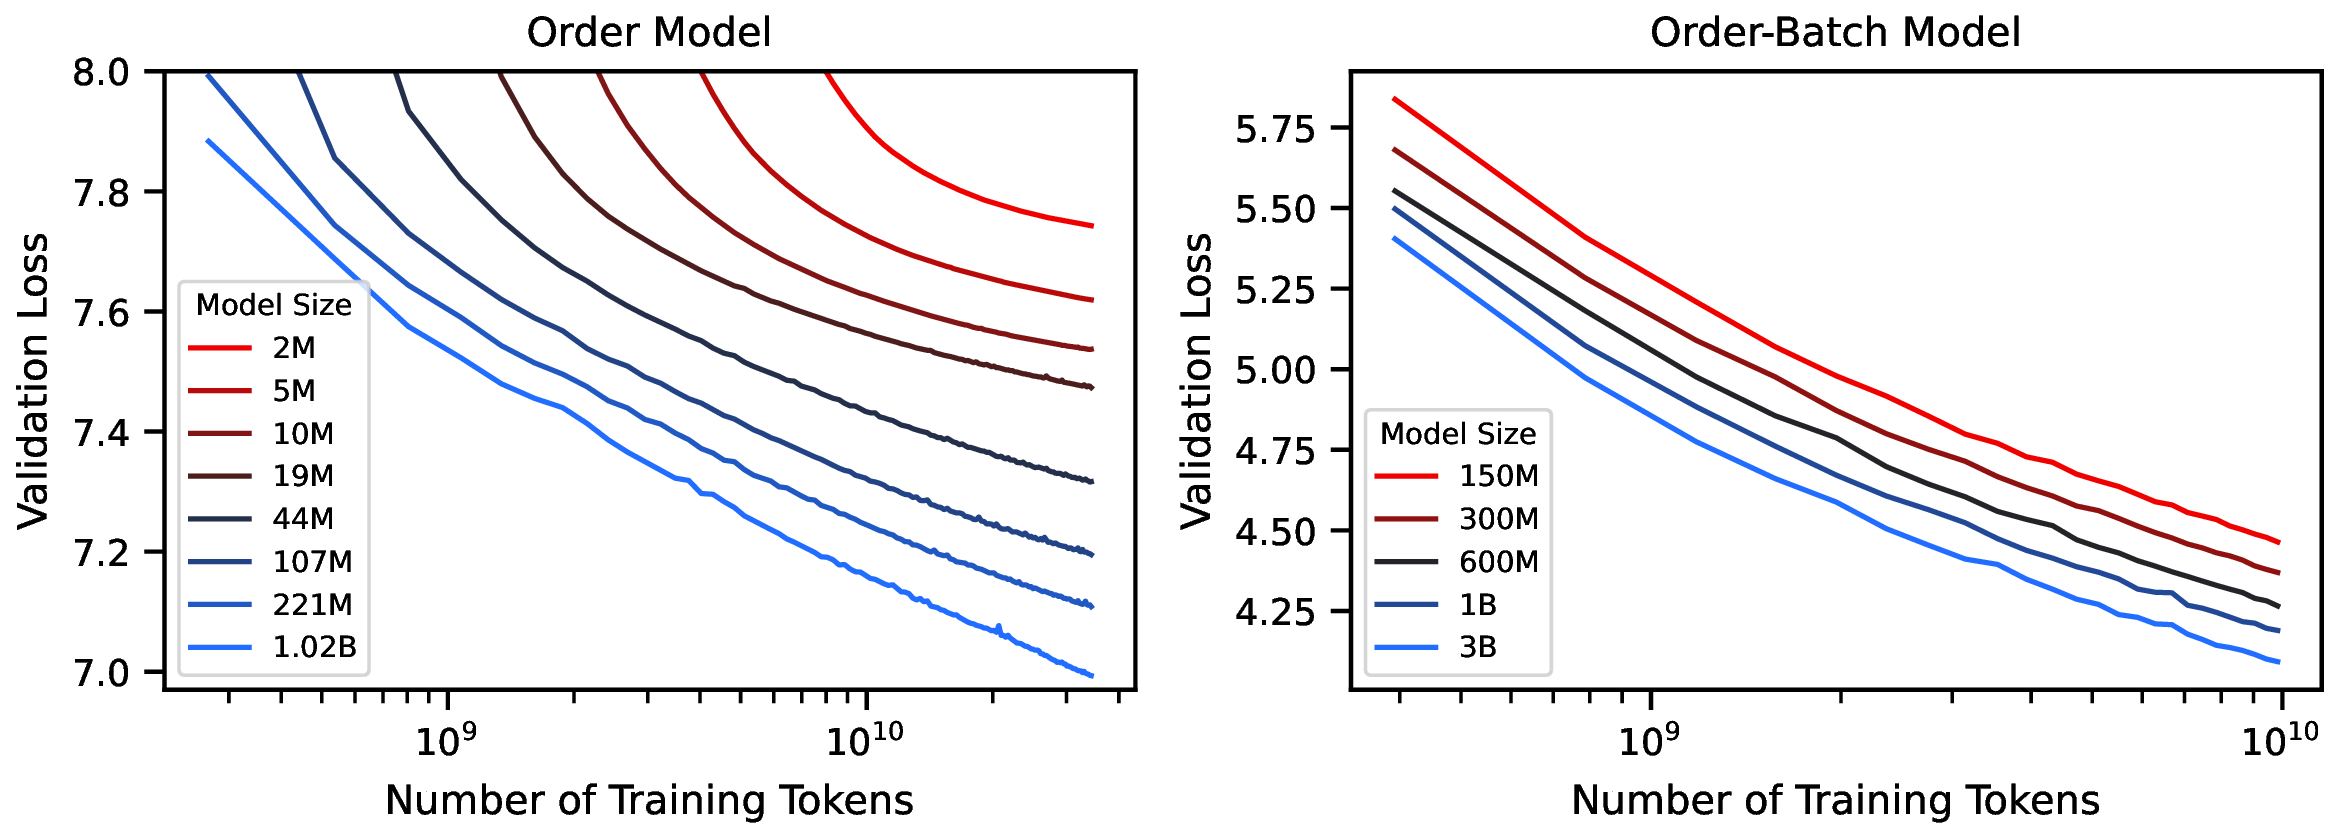
To assess the scalability of the Large Market Model (LMM), we evaluated its performance across varying data scales and model sizes. Our findings indicate that as the size of the data and the model increases, the performance of the LMM significantly improves, consistent with the scaling laws observed in other foundation models. This suggests that the potential of LMM can be further unlocked by leveraging larger datasets and more extensive computational resources.
Realistic Simulations
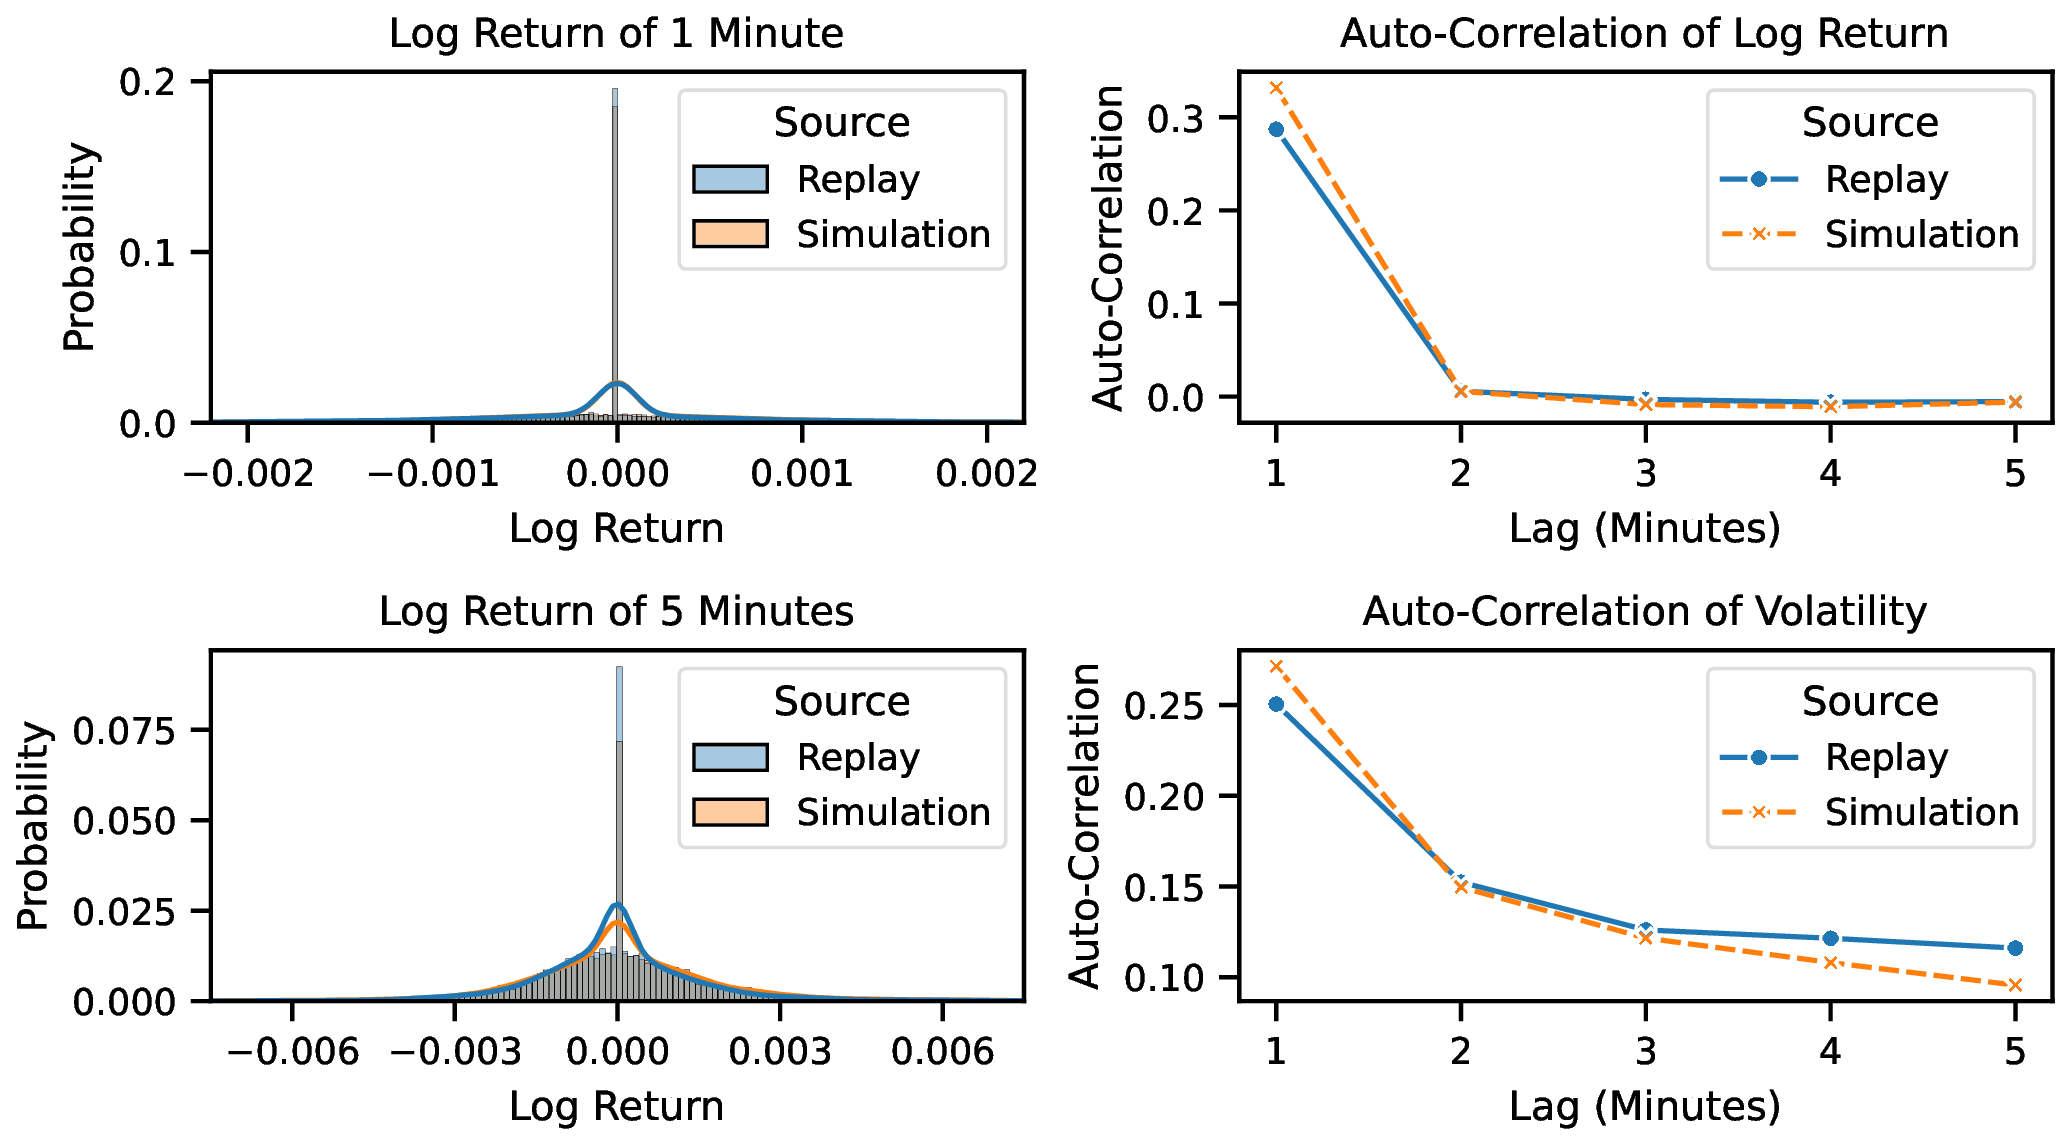
To assess the realism of MarS's market simulations, we compare simulated data against
key stylized facts derived from historical market data. These stylized facts serve as
robust benchmarks, ensuring that our simulations accurately reflect real-world
market behaviors.
The figure above is illustration of stylized facts: The upper
left panel displays the 1-minute log return distribution, the lower left panel shows the
5-minute log
return distribution, the upper right panel depicts log return auto-correlation, and the
lower right panel illustrates volatility auto-correlation.
The results demonstrate a high level of consistency between MarS's simulated data and
real-world market behaviors. These findings confirm that MarS can generate simulations
that closely mirror real market conditions, making it a reliable tool for practical
applications.
Controllable Simulations
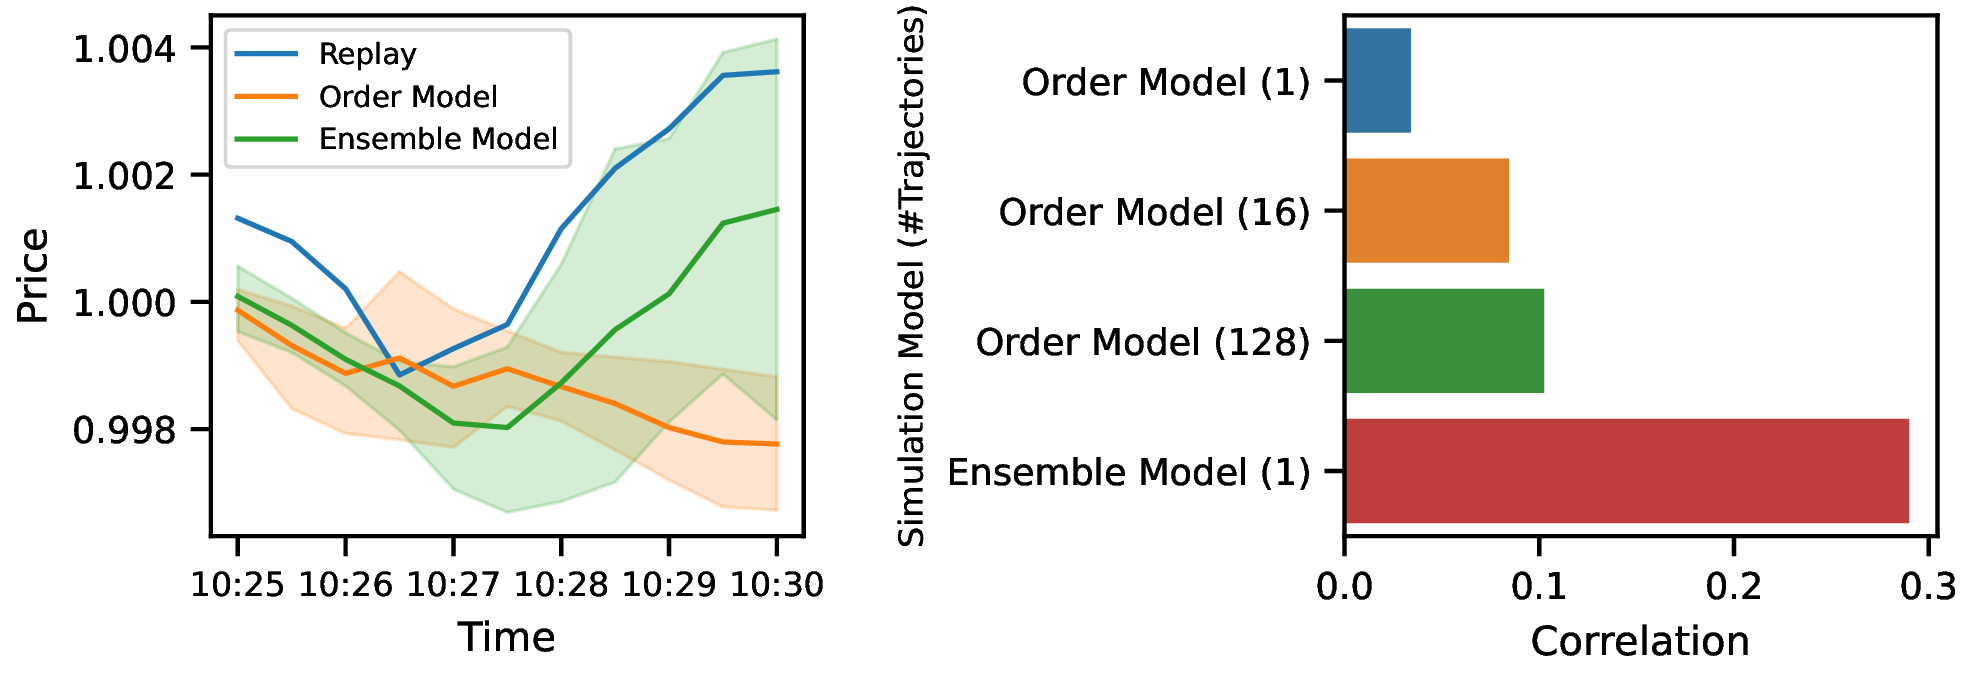
We demonstrate MarS's controllability by generating scenarios that mirror replays. An order batch is generated based on minute-level guiding signals from the replay curve, integrated with the order model within an ensemble model to generate trading orders. The figure upper-left shows that the ensemble model closely follows the replay curve, whereas the order model shows less correlation. We further compare the correlation between simulated and replay prices with different simulated trajectory numbers on the upper-right figure. MarS's ensemble model shows a higher correlation with replayed data than the baseline model, even with fewer simulated trajectories. This demonstrates MarS's effectiveness in creating controllable market simulations with minimal computational overhead.
Interactive Market Dynamics
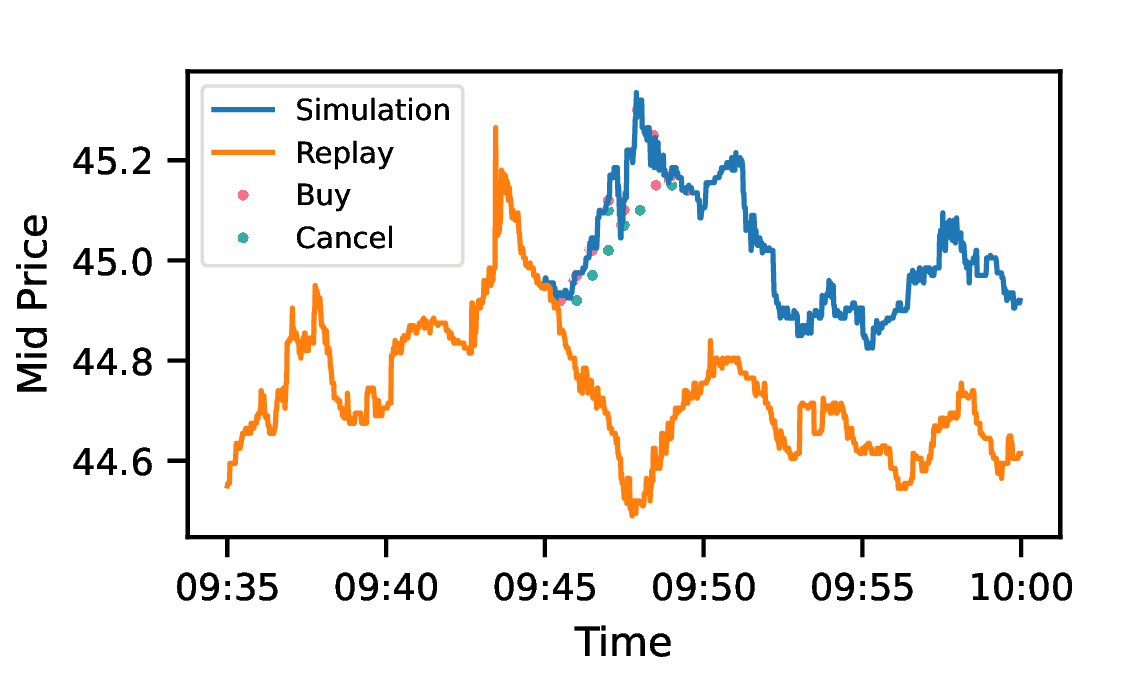
Understanding market impacts is crucial for a wide range of applications. MarS allows for the simulation of market impacts by generating orders based on detailed order-level data. The figure above shows the market impact of a TWAP agent executing a large trade volume. These results illustrate that MarS can effectively model the impact of trading strategies on market prices, providing valuable insights for market participants and aiding in the development of more robust trading strategies.
Trade-off between Control and Interaction
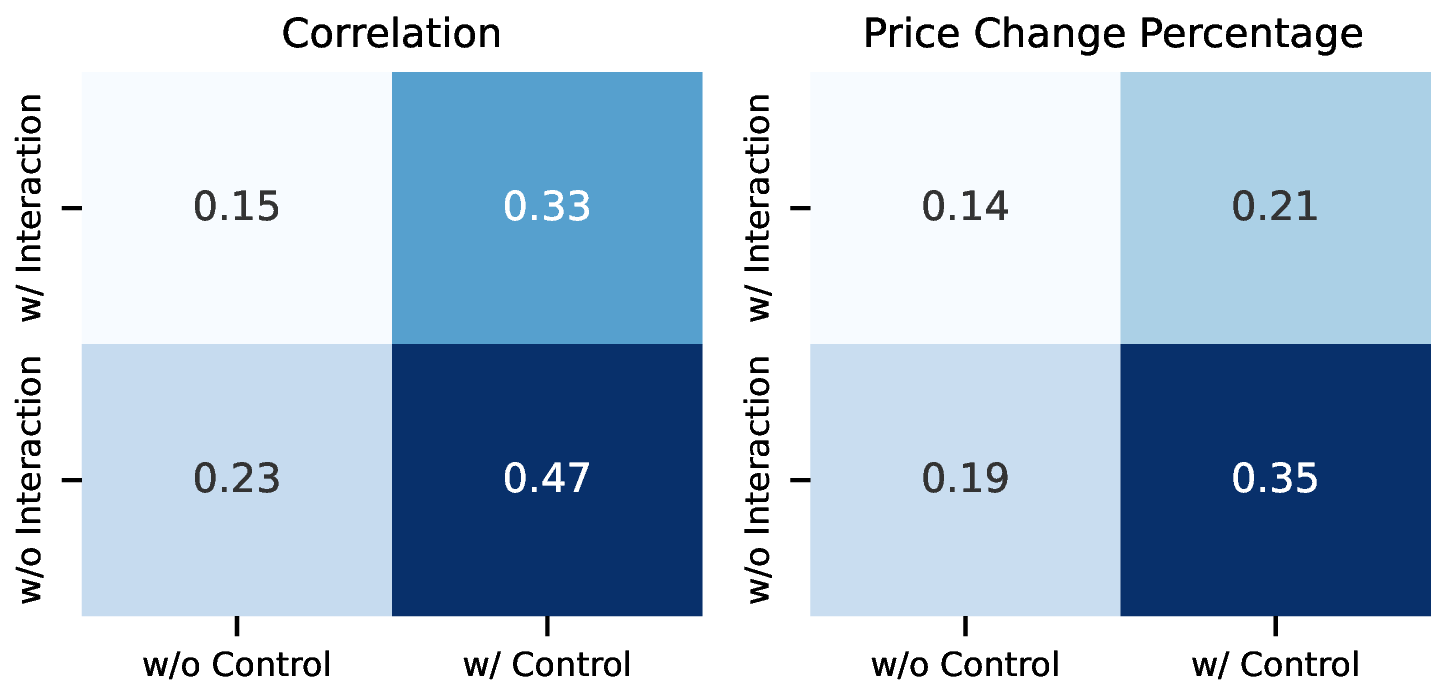
We evaluate the ability of MarS to balance control and interaction using replay data exhibiting a 0.3 to 0.5 price change over 5 minutes. Our control target is to generate a similar price change scenario. When control is enabled, the ensemble model is guided by the replay curve. The figure above illustrates the trade-off between control and interaction. Our findings indicate that configurations focused solely on control achieve the highest correlation with historical data, while introducing interactive agents reduces control precision but enhances realism. This trade-off allows MarS to adapt to diverse simulation needs, making it a versatile platform for both research and practical use.
Acknowledgment
We thank intern Keli Wen for his valuable contributions to the MarS project during his internship, particularly in designing and developing the demo and project website, as well as his innovative technical explorations.

